Michigan Sea Grant to hold free lake level workshop in the eastern Upper Peninsula on Nov. 5.
By Elliot Nelson

High lake levels flood Boulevard Road along the straits of Mackinac in September 2019. Photo: Elliot Nelson, Michigan Sea Grant
If you’ve visited any of the Great Lakes in 2019 you’ve probably noticed that lake water levels are high. Beaches are smaller than they’ve been in decades. Trees and vegetation along the shoreline are being washed into the lakes. Docks are barely visible and sometimes even under water. Shoreline homes, roads, and other infrastructure are facing flooding. Three of the five Great Lakes reached monthly all time record highs in 2019, and while water levels are starting to abate in some lakes, all are still above average for the season.
Water level fluctuations
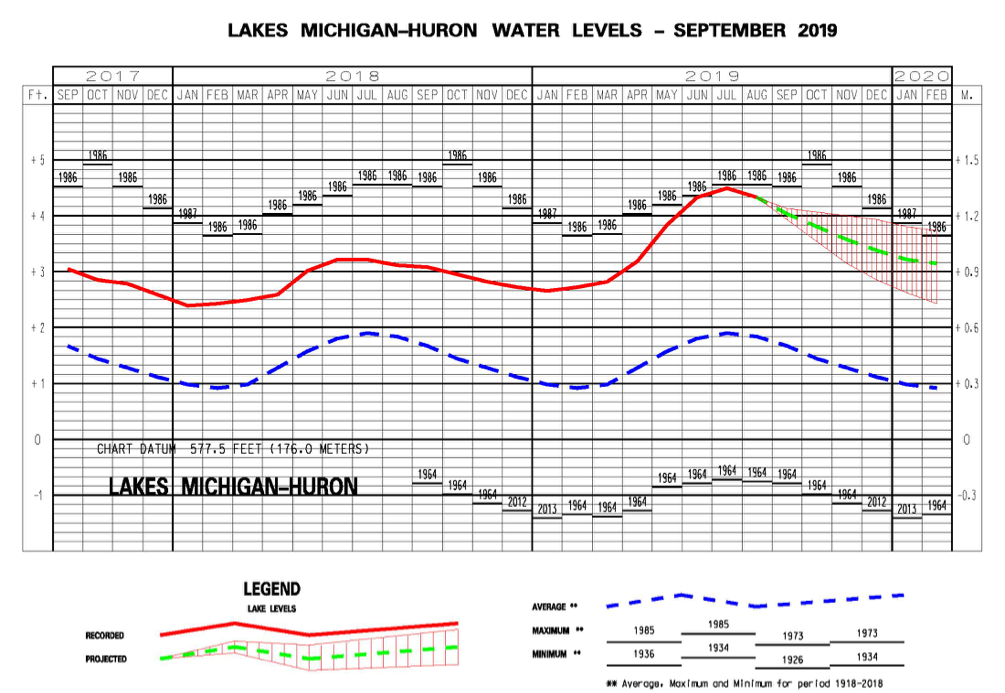
Water levels in the Great Lakes fluctuate up and down on an annual cycle. As the lakes warm in the spring and summer, thermal expansion, coupled with snow melt and precipitation, cause lake levels to rise. Depending on the lake, this fluctuation is normally on the magnitude of 10 inches to 20 inches, and the lakes typically peak in July-September. As the weather cools, and the lakes cool, evaporation and thermal contraction cause lake levels to fall, with the lowest levels typically being seen January – March. Figure 1 shows an annual pattern for lake Michigan-Huron.
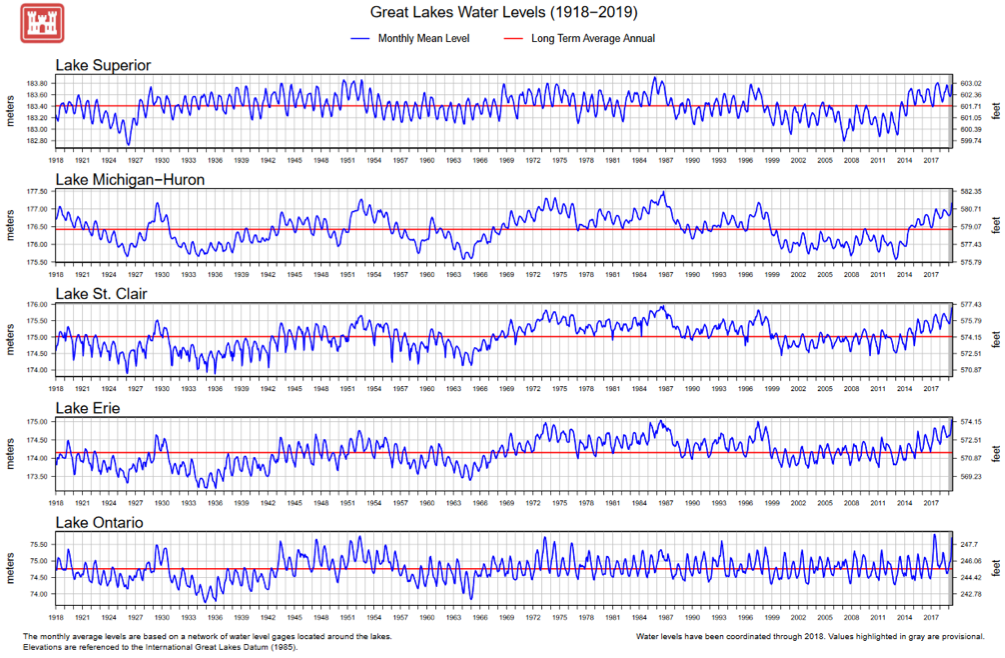
However, these annual cycles aren’t the only type of fluctuation. The Great Lakes seem to follow decades-long cycles where they rise and fall by anywhere from about 4 feet (Lake Superior) to 6.5 feet (lake Michigan-Huron). Scientific monitoring has shown the Great Lakes do change on long term scales of several years. The fluctuations may be caused by long-term weather patterns, primarily dealing with temperature, storm systems entering from outside of the Great Lakes basin, and wind and evaporation patterns. The idea of an “average” Great Lakes water level is really a misnomer as the lakes are always moving up or down over the course of several years. Figure 2 shows the long term data set of lake levels for the past 100+ years.
Monitoring the lakes and 2019 records
Lake levels are measured by gauges set across the Great Lakes by various federal agencies, such as the National Ocean and Atmospheric Administration and the Canadian department of Fisheries and Oceans. Because of the daily effects of waves and wind, lake levels are aggregated into a monthly average. Each week the lake levels are reported by the Army Corps of Engineers, and include a forecast for the rest of the month. The Army Corp also releases a monthly forecast that includes a six-month prediction on how levels will change, as well as a water level outlook every three months that forecasts water level scenarios out for one year. This monitoring of lake levels has taken place for more than 100 years, giving a long-term picture of the lakes’ fluctuations. For 2019, the Army Corps reported record high lake levels in lakes Superior, Erie, and Ontario for the months of May, June and July. Lakes Michigan and Huron, monitored together as they are hydrologically one lake, were within inches of record highs for May, June and July.
September and October of 2019 haven’t been forgiving months in terms of seeing swift decreases in lake levels. For Lake Superior, levels actually increased, as opposed to the typical fall decrease. As of October 18, 2019, the Great Lakes basin has received 145% of its average precipitation for the month of October. High precipitation across the basin has caused many of the lakes to remain higher then they typically would in the higher evaporation months of September and October. This may lead to water levels being just as high, or even higher in 2020.
Survey seeks input
In an effort to gauge the impacts of water levels on shoreline property owners and businesses, the International Joint Commission (IJC) seeks to gather input on people’s experiences with the high waters through a questionnaire. The IJC is a bi-national organization established by Canada and the United States to help navigate issues and resolve disputes over waters shared between the two countries and for settling other transboundary issues. One of the roles of the IJC is to make decisions about Great Lakes water level flows that can be regulated, those being the outflow of Lake Superior at the St. Marys River, the outflow of Lake Erie above Niagara Falls, and the outflow of Lake Ontario into the St. Lawrence River System. However, the regulation of outflows does not mean it is possible to completely control the lakes’ levels, because water levels are affected by so many other natural factors already described above. The IJC’s regulation of outflows can allow for less extreme water levels, while also taking into account navigation, hydropower needs, and the interests of shoreline and riparian owners.
Great Lakes water levels will continue to change over the years. While we are seeing highs now, we will almost certainly expect to see lows again sometime in the next number of years. Reporting on the impacts of water levels is important, as is being aware of how they may change in the future. Residents and business owners of shoreline property can access a variety of resources, such as Living on the Coast, to help prepare for fluctuations to the Great Lakes. Stopping the fluctuations isn’t very viable, but being prepared for them to change is something everyone can do.
Water level workshop set in U.P.
Want to learn more about changes to the lake levels? Michigan Sea Grant is hosting a water levels talk in the Upper Peninsula in Hessel. The free workshop will be held 7 p.m. to 8 p.m. Nov. 5 at the Hessel School House, 3206 W. Cedar St. The workshop will address how water levels are calculated, future predictions, and briefly touch on a project entitled Great Lakes One Waters (GLOW), a program that promotes resilience in infrastructure, economics, and recreation, in the face of extreme weather events.
Michigan Sea Grant helps to foster economic growth and protect Michigan’s coastal, Great Lakes resources through education, research and outreach. A collaborative effort of the University of Michigan and Michigan State University and its MSU Extension, Michigan Sea Grant is part of the NOAA-National Sea Grant network of 33 university-based programs.
This article was prepared by MSU under award NA14OAR4170070 from the National Oceanic and Atmospheric Administration, U.S. Department of Commerce through the Regents of the University of Michigan. The statements, findings, conclusions, and recommendations are those of the author(s) and do not necessarily reflect the views of the National Oceanic and Atmospheric Administration, the Department of Commerce, or the Regents of the University of Michigan.