Purpose of Research
The National Weather Service forecasters need frequent, high-quality marine observations to examine conditions to prepare forecasts and to verify forecasts once the noted time period has passed. Other users rely on the observations and forecasts for commercial and recreational activities.  The National Data Buoy Center (NDBC) provides hourly observations from a network of about 90 buoys and 60 Coastal Marine Automated Network (C-MAN) stations to help meet these needs. All stations measure:
- Wind speed
- Wind direction
- Wind gusts
- Barometric pressure
- Air temperatures
In addition, all buoy stations and some C-MAN stations measure sea surface temperature and wave height and period. Conductivity and water current are measured at selected stations.
Research Methods
The observations from moored buoys and C-MAN stations are transmitted hourly through NOAA Geostationary Operational Environmental Satellites (GOES) to a ground receiving facility at Wallops Island, Virginia, operated by the NOAA National Environmental Satellite, Data, and Information Service (NESDIS). Some stations report via commercial low earth orbiting satellites. The satellite reports are immediately relayed to the NWS Telecommunications Gateway (NWSTG) in Silver Spring, Maryland. NDBC also serves as a data assembly center for receiving, quality controlling, and disseminating measurement data from other stations owned and maintained by non-federal regional ocean observing systems, members of the U.S. Integrated Ocean Observing System (IOOS). Most of the IOOS partners send their reports over the Internet to NDBC systems at the NWSTG.
Calculations
The real time files generally contain the last 45 days of “real time” data — data that went through automated quality checks and were distributed as soon as they were received. Historical files have gone through post-processing analysis and represent the data sent to the archive centers. The formats for both are generally the same, with the major difference being the treatment of missing data. Missing data in the real time files are denoted by “MM” while a variable number of 9’s are used to denote missing data in the historical files, depending on the data type (for example: 999.0 99.0). Here is some additional information about parameters you will see in the data sets:
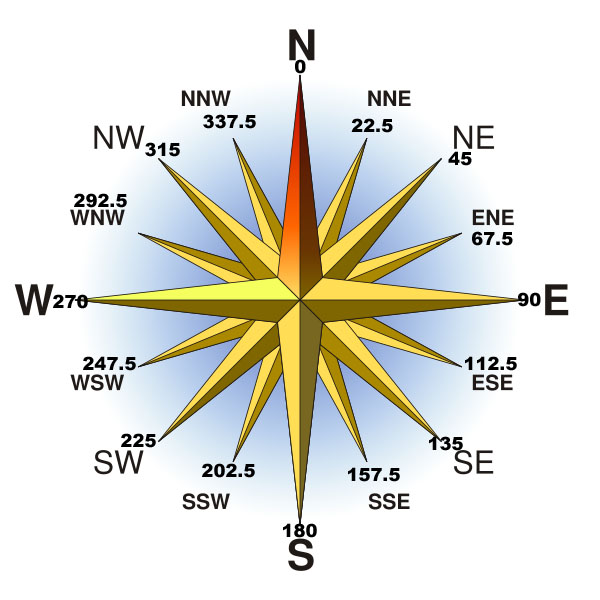
- Wind direction is the direction the wind is coming from in degrees clockwise from true north during the same period that data were collected. [add compass here]
- Wind speed (meters/second) is averaged over an eight-minute period for buoys and a two-minute period for land stations. Wind speed is reported hourly.
- Significant wave height (meters) is calculated as the average of the highest one-third of all of the wave heights during the 20-minute sampling period.
- Dominant wave period (seconds) is the period with the maximum wave energy.
- Sea level pressure is recorded in millibars.
- The water level is measured in feet above or below Mean Lower Low Water (MLLW). Mean Lower Low Water is an oceanographic reference point defined as the 19-year average of the lower of the two daily low tides.

